REGULATORY DATA × HEALTHCARE ANALYTICSCASE STUDY / 12
FDA Medical-Device Recall Response Timelines
An operational analysis of the time between firm recall initiation and publication in an FDA Enforcement Report.
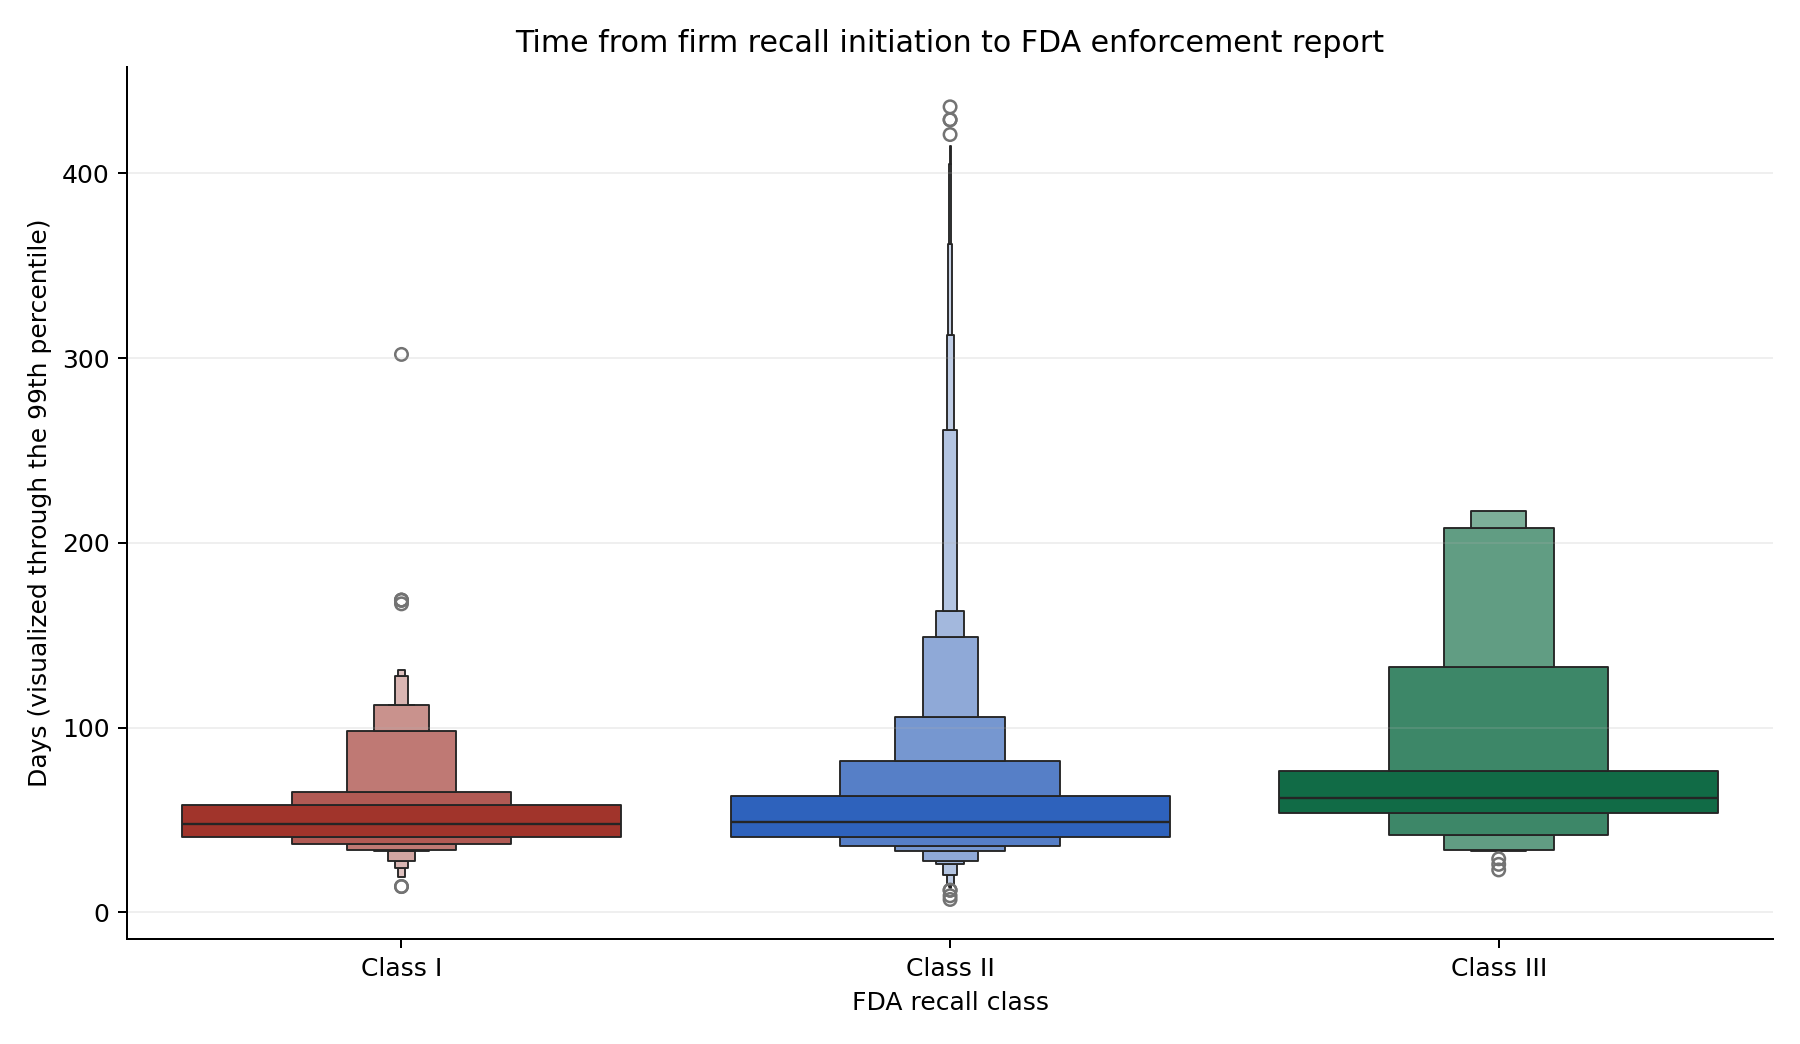
Key insight: Median initiation-to-report time was 48 days for Class I, 50 for Class II, and 62 for Class III records. The class difference was statistically detectable but had a small effect size.
This interval does not measure patient harm, recall effectiveness, product correction time, or manufacturer or FDA performance. Records represent recalled products and multiple records can belong to one event.
SASPythonDuckDB SQLRegulatory data QA
Explore the repository
INFECTIOUS DISEASE × AGE-SPECIFIC SURVEILLANCECASE STUDY / 11
RESP-NET Respiratory Hospitalization Burden
A 53-week analysis of how COVID-19, influenza, and RSV hospitalization burden differed across 11 mutually exclusive age groups.
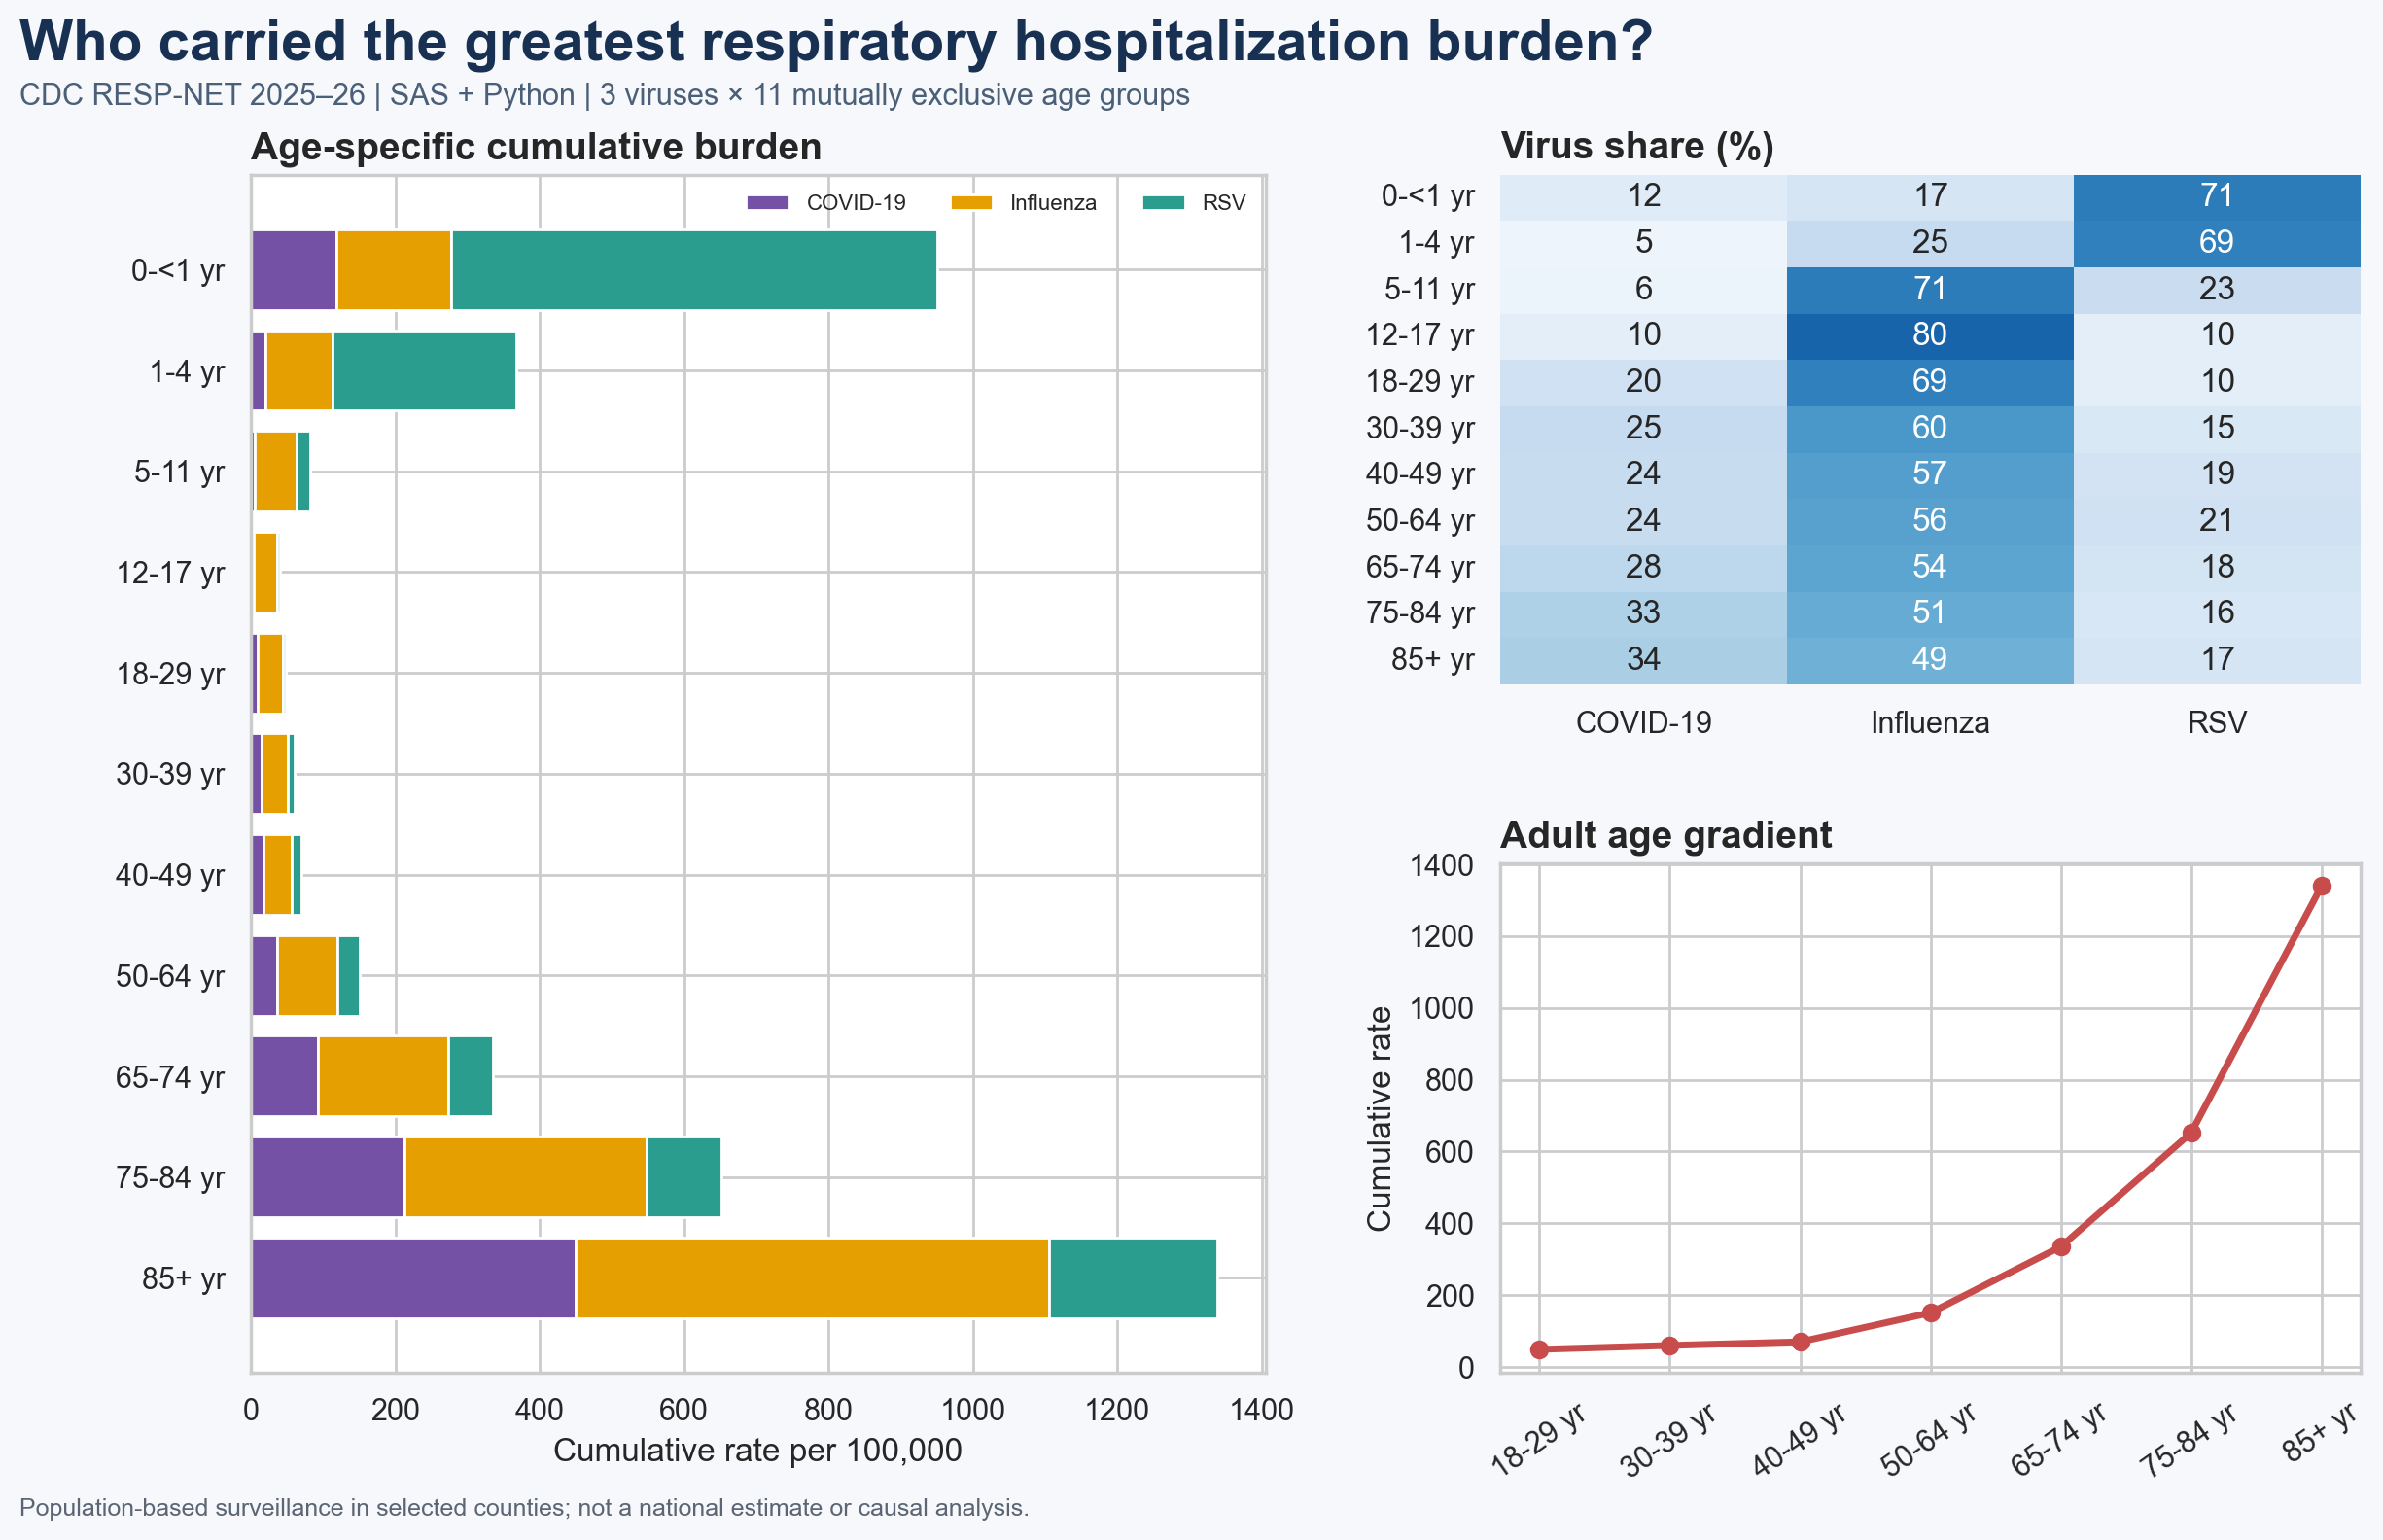
Key insight: Adults aged 85+ had the highest combined cumulative rate at 1,339 per 100,000, while infants ranked second at 951. RSV accounted for 71% of the infant rate.
RESP-NET covers selected surveillance counties and is not a national estimate. Results are descriptive, unadjusted, and should not be interpreted as causal effects or hospital-quality rankings.
SASPythonCDC RESP-NETQA/QC
Explore the repository
MATERNAL HEALTH × GEOSPATIAL ANALYTICSCASE STUDY / 10
CMS Birthing-Friendly Designation Density
A state-level screening analysis of CMS structural designations standardized to the population of women ages 15–44.
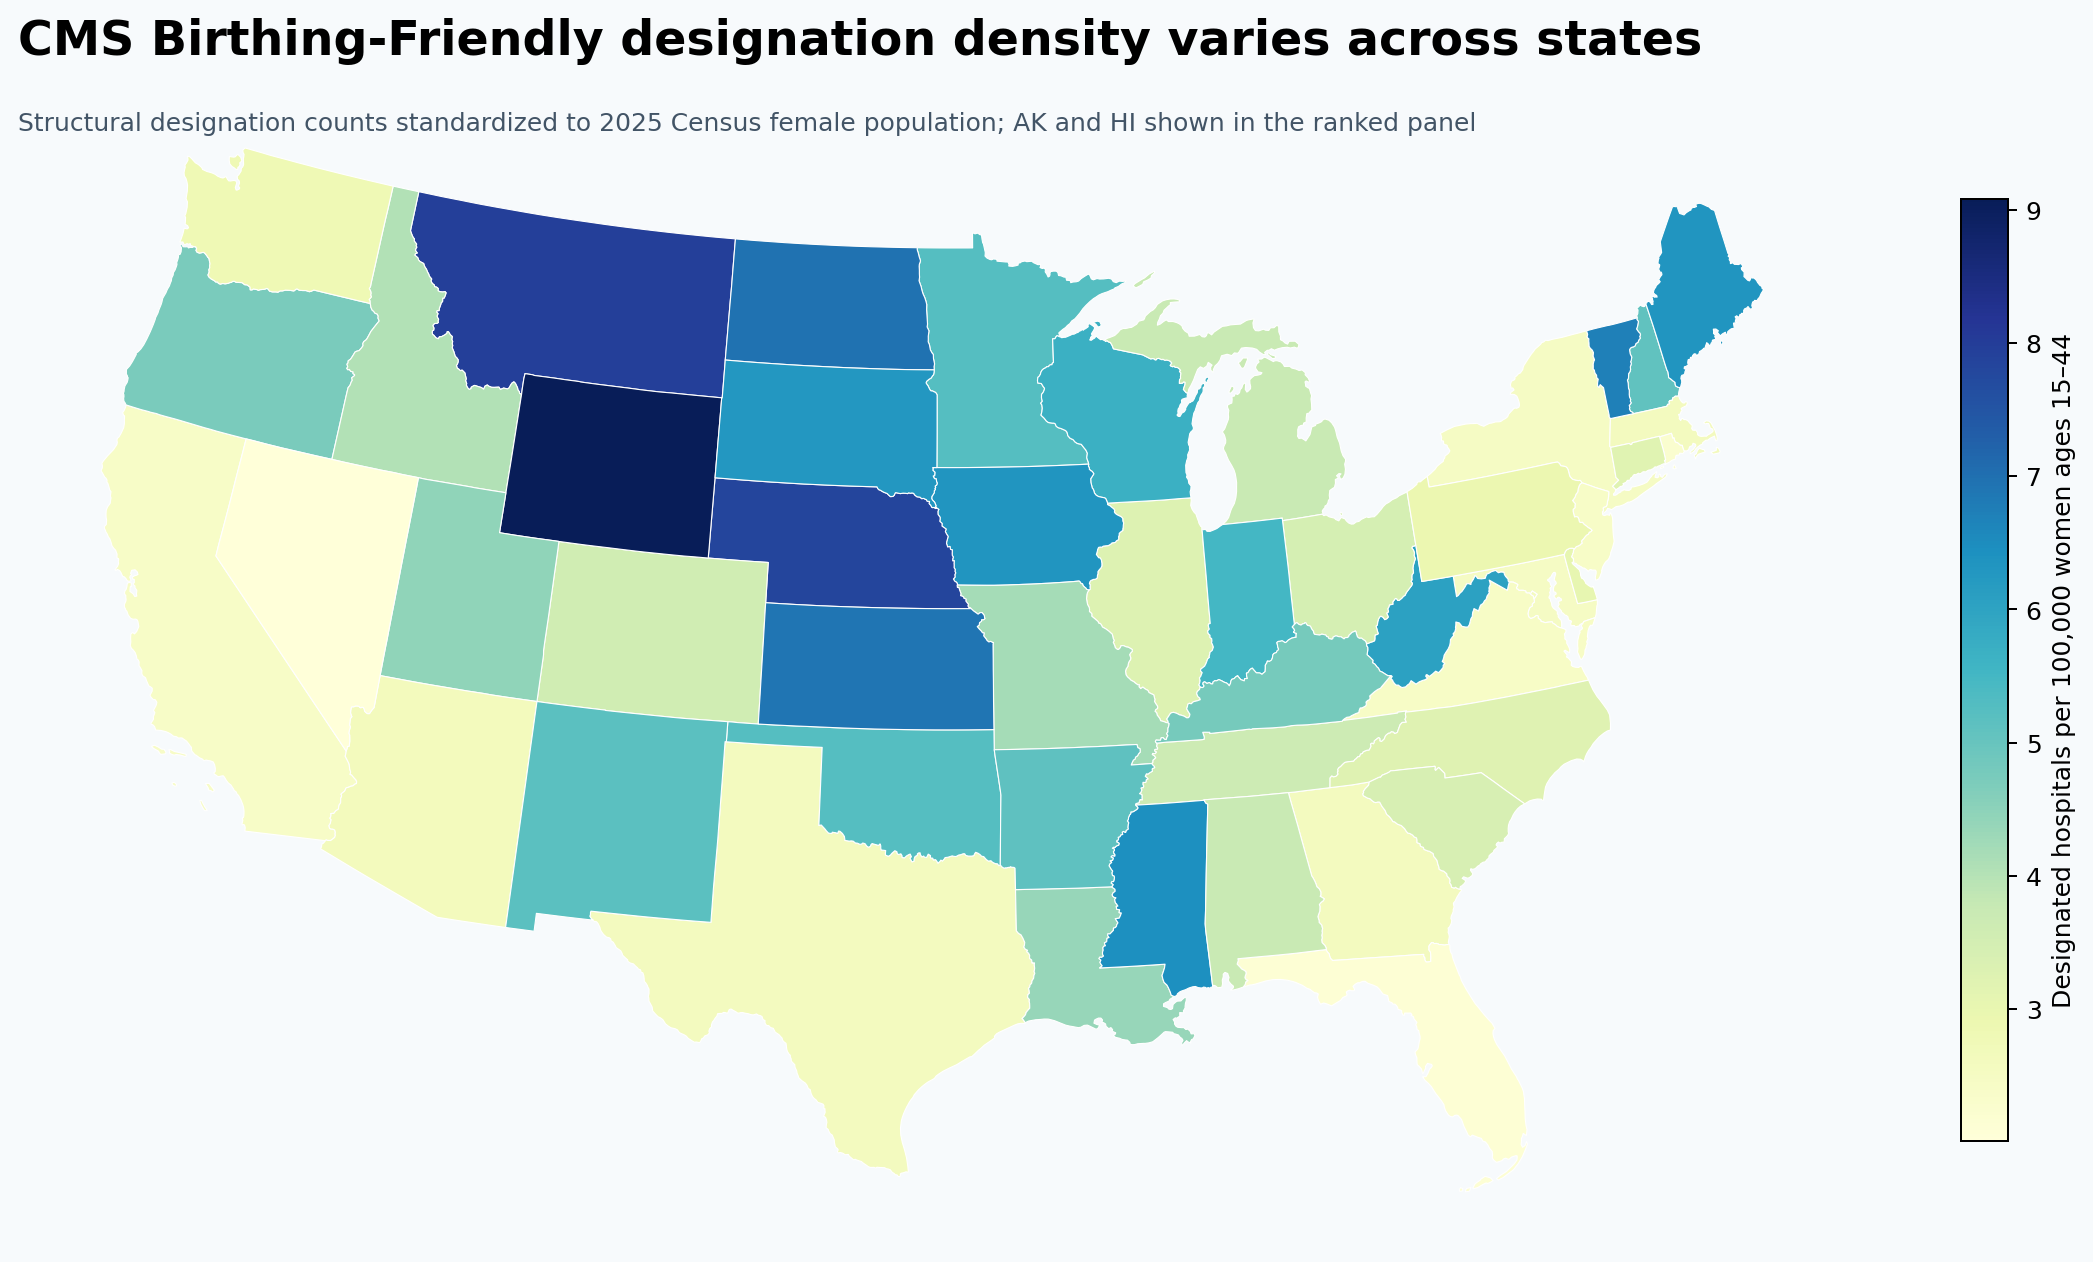
Key insight: 2,256 hospitals carried the designation across the 50 states and Washington, D.C., or 3.33 per 100,000 women ages 15–44. State density ranged from 2.01 in Nevada to 9.08 in Wyoming.
The designation is a structural quality signal, not a clinical safety ranking. State density does not measure delivery volume, travel time, maternity-unit availability, or individual access.
DuckDB SQLPythonGeoPandasQGIS-ready GIS
Explore the repository
BEHAVIORAL HEALTH × GEOSPATIAL ANALYTICSCASE STUDY / 09
County Behavioral Health Priority Signals
A transparent county screening workflow combining modeled depression, frequent mental distress, and lack-of-insurance estimates.
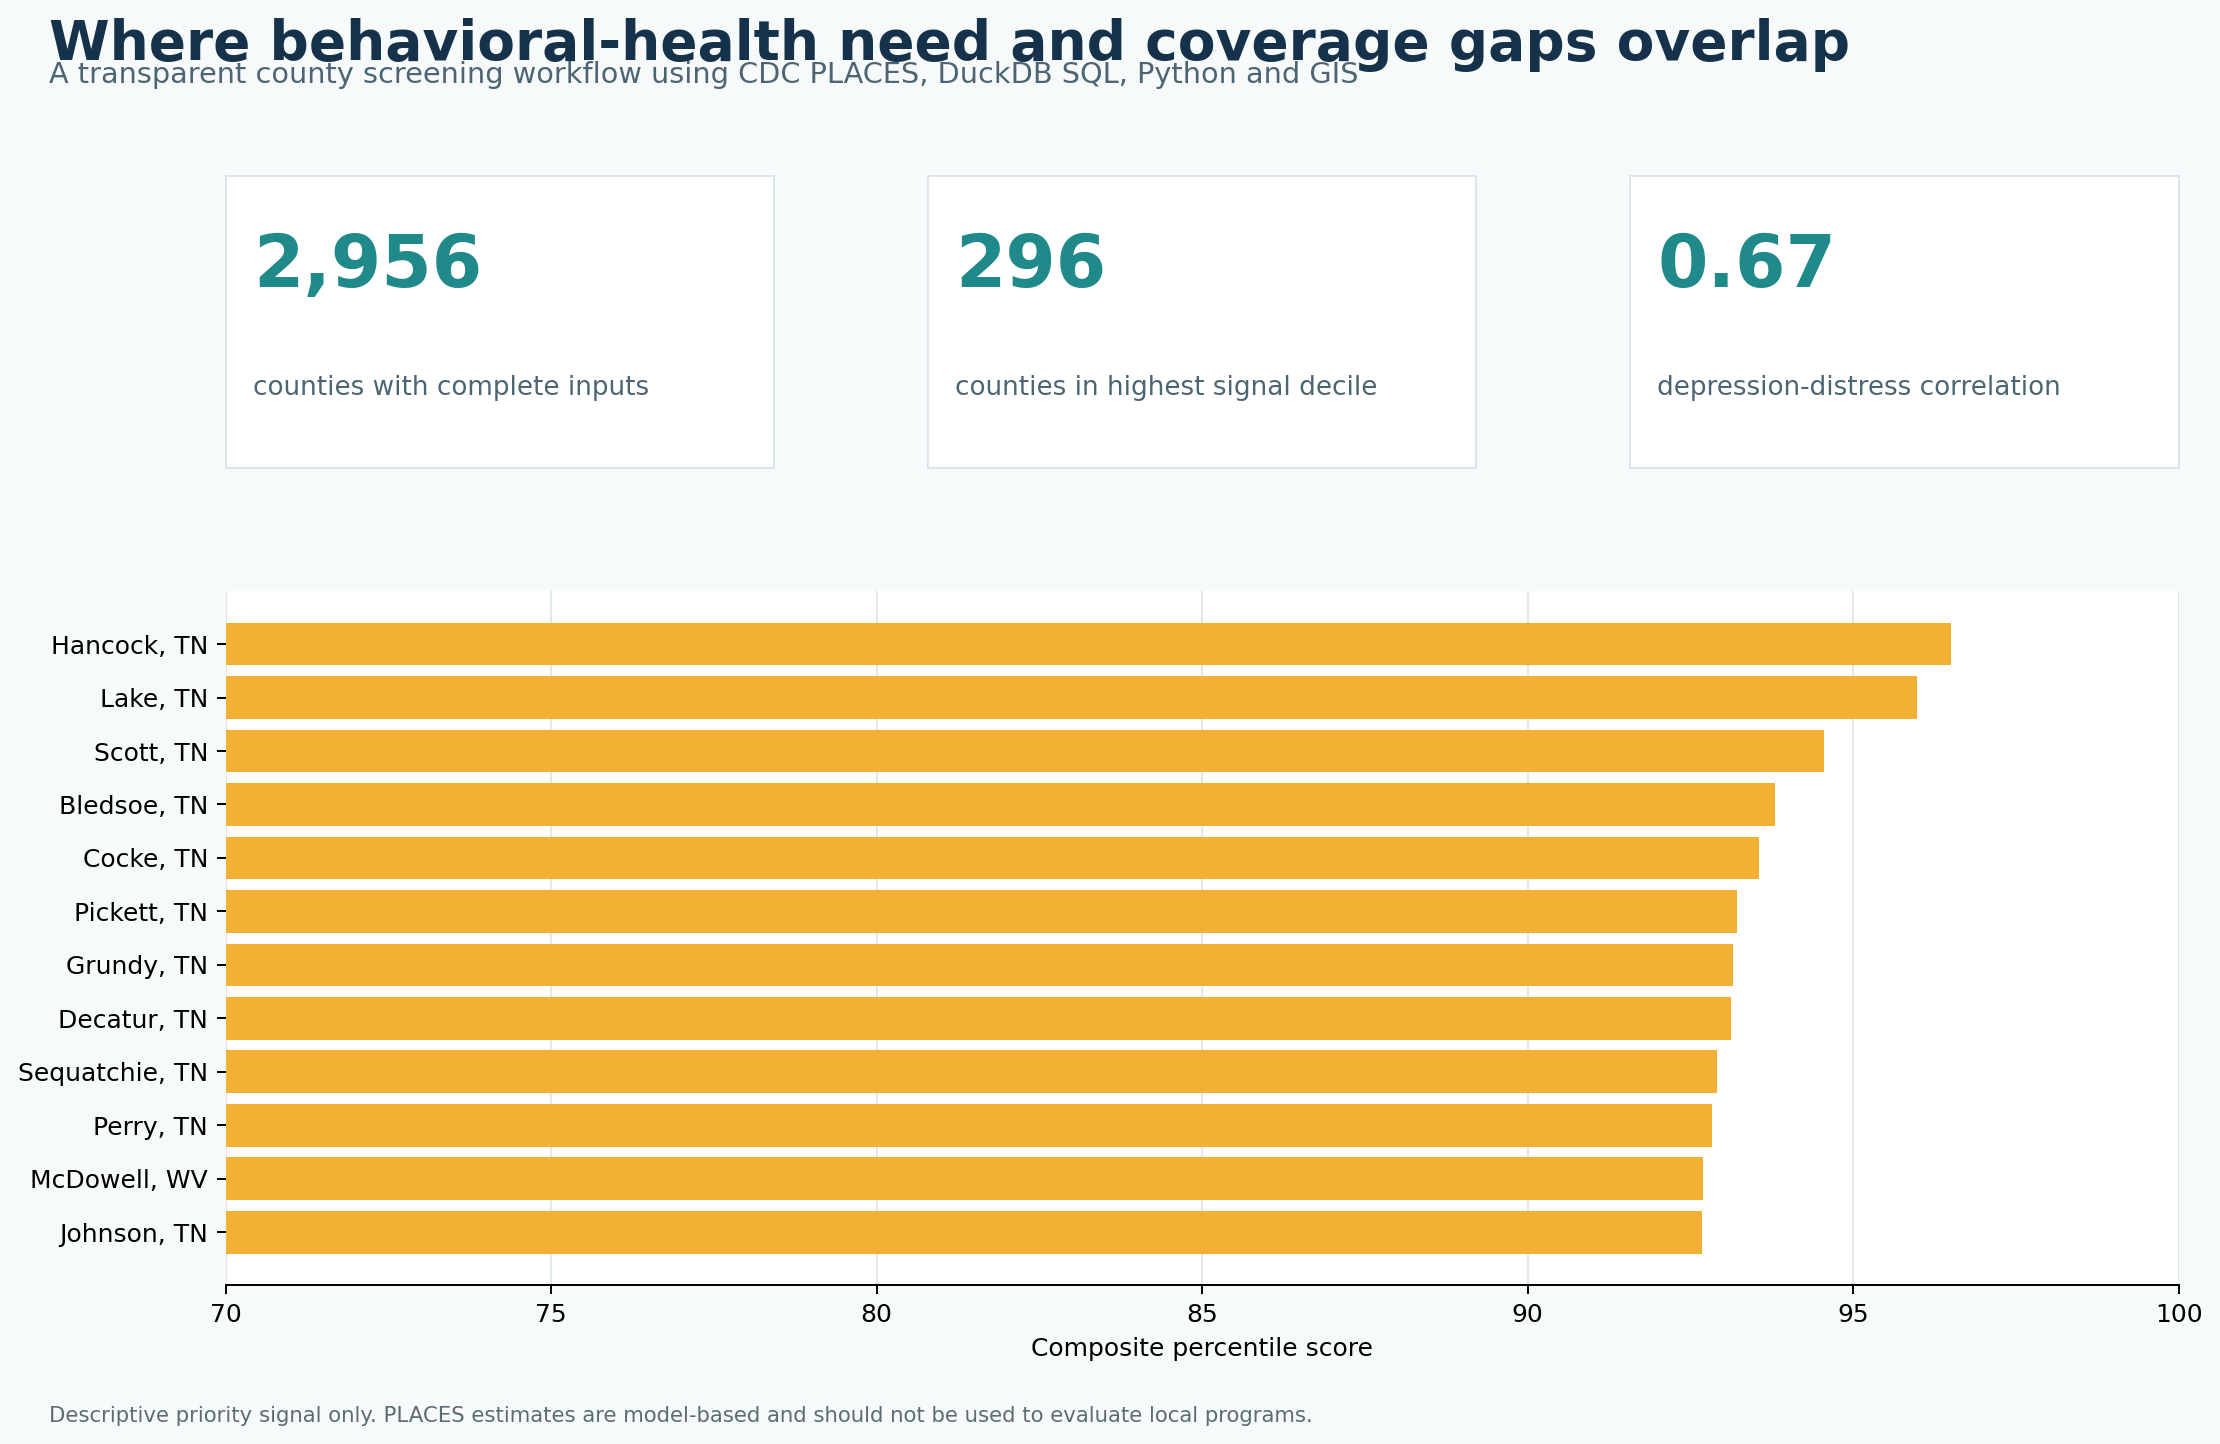
Key insight: 296 counties formed the highest signal decile. Depression and frequent mental distress estimates correlated at 0.67, while insurance gaps varied within that relationship.
CDC PLACES values are model-based, and Kentucky and Pennsylvania lacked complete inputs. This equal-weight percentile score supports triage only and cannot establish causes, describe individual risk, or evaluate local programs.
DuckDB SQLPythonCDC PLACESQGIS-ready GIS
Explore the repository
DIABETES × KIDNEY HEALTHCASE STUDY / 08
The CKD Awareness Gap
A survey-weighted NHANES analysis of laboratory-defined CKD and reported kidney-disease awareness among U.S. adults with diagnosed diabetes.
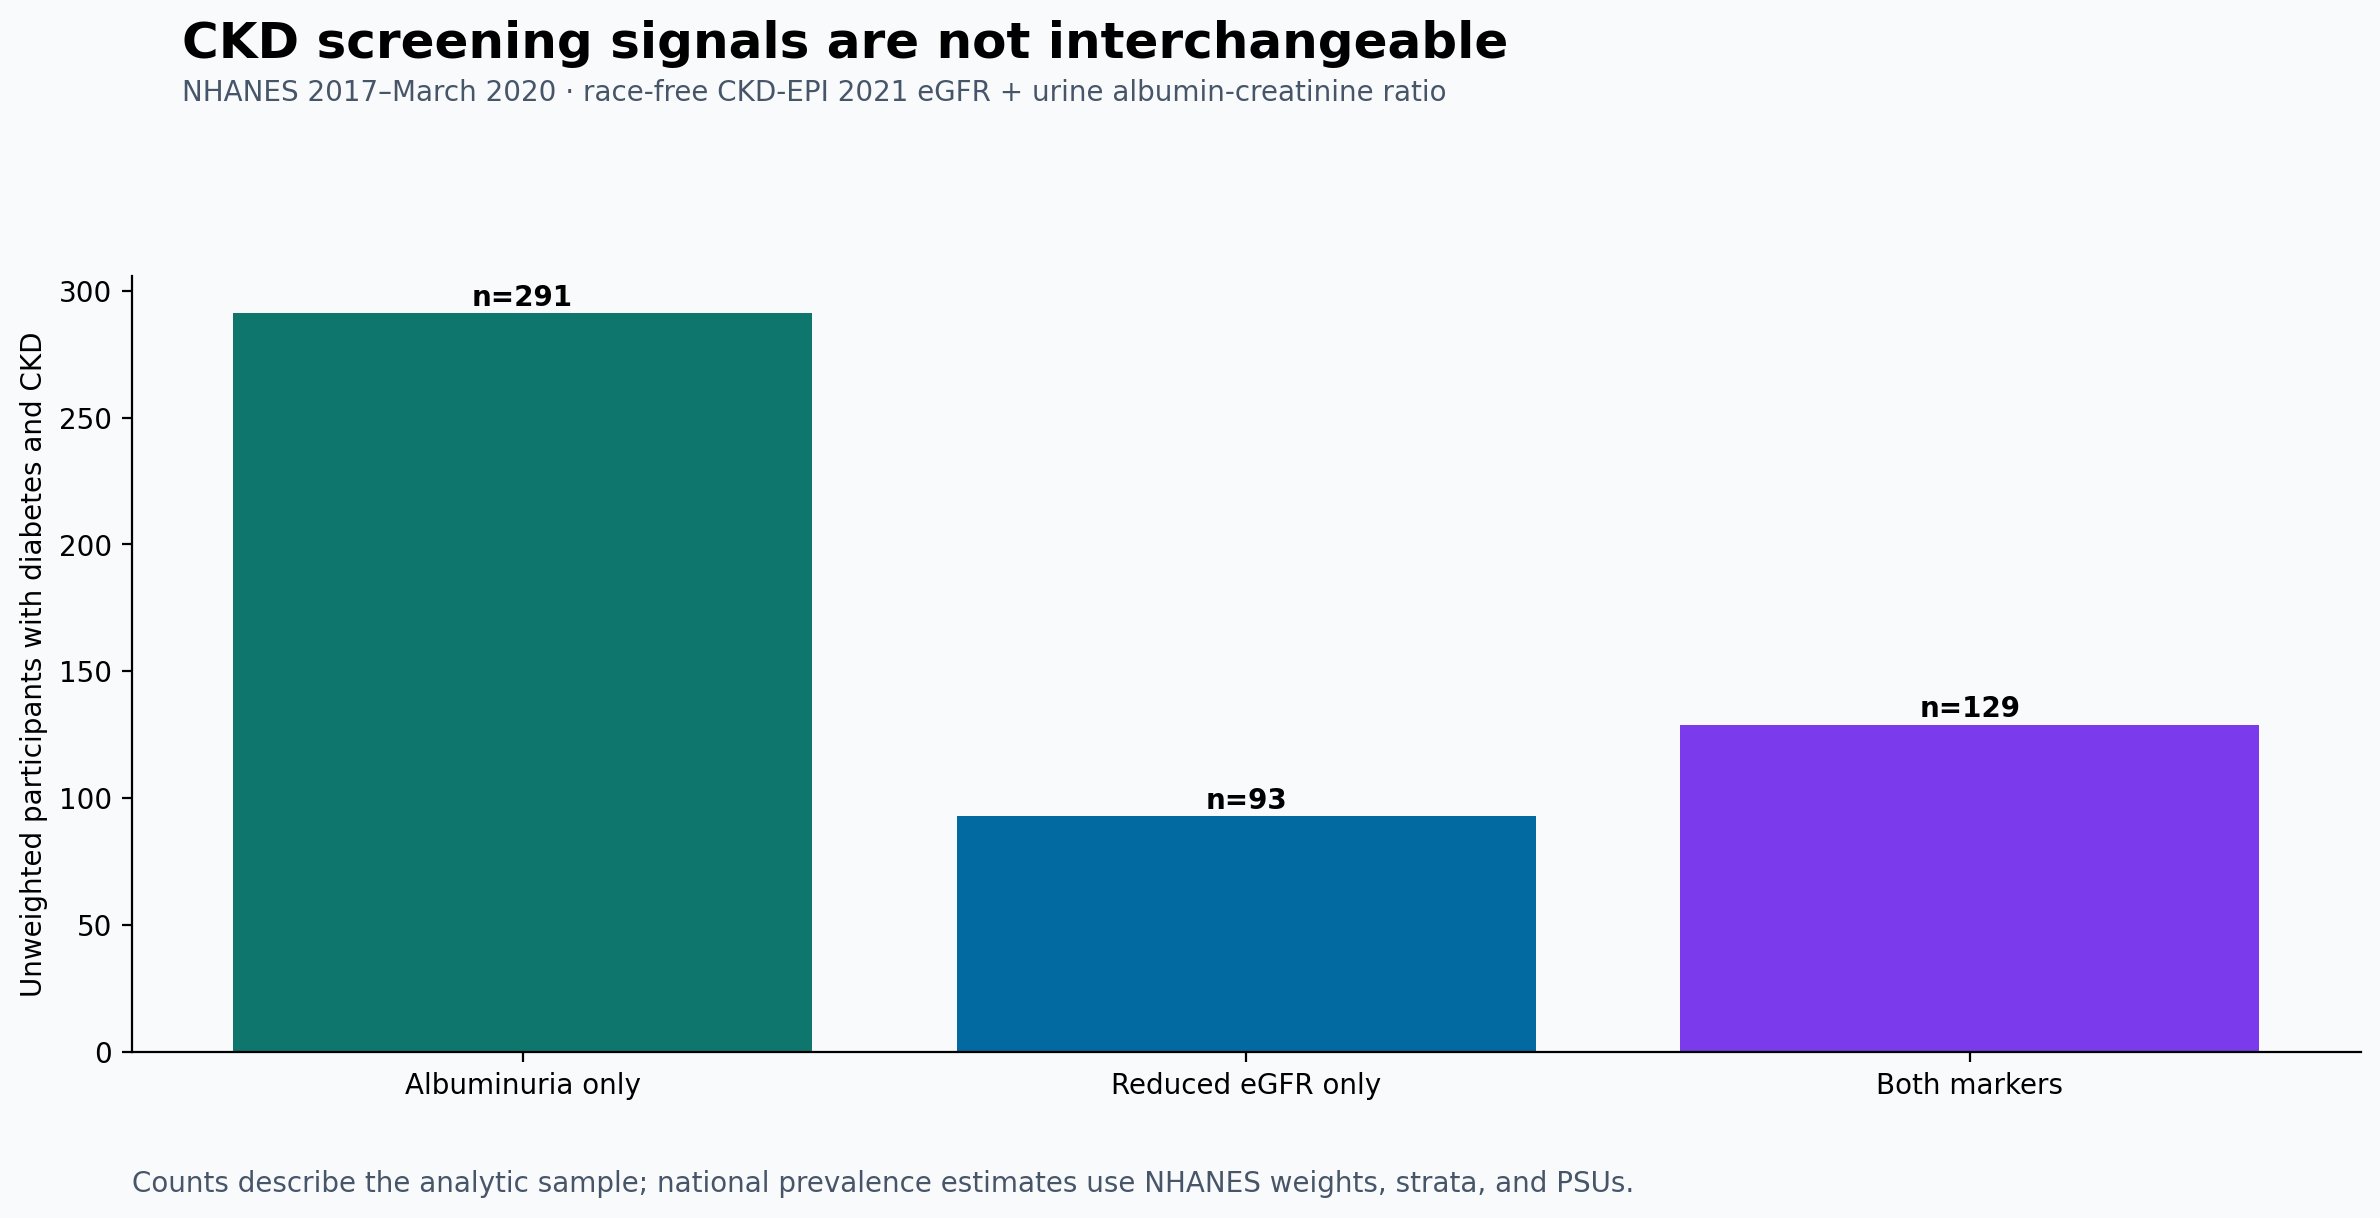
Key insight: 39.3% of adults with diagnosed diabetes met the analytic CKD definition; among adults with diabetes and CKD, 82.0% did not report being told they had weak or failing kidneys.
Single-visit biomarkers cannot establish chronicity. Reported awareness reflects one NHANES question and is not a clinical diagnosis or program evaluation.
SASPythonNHANESSurvey methods
Explore the repository
HEALTHCARE QUALITY × WORKFORCE ANALYTICSCASE STUDY / 07
Nursing Home Staffing and Quality Signals
A CMS analysis testing how staffing capacity and nursing-staff turnover align with low overall ratings after facility and market context are considered.
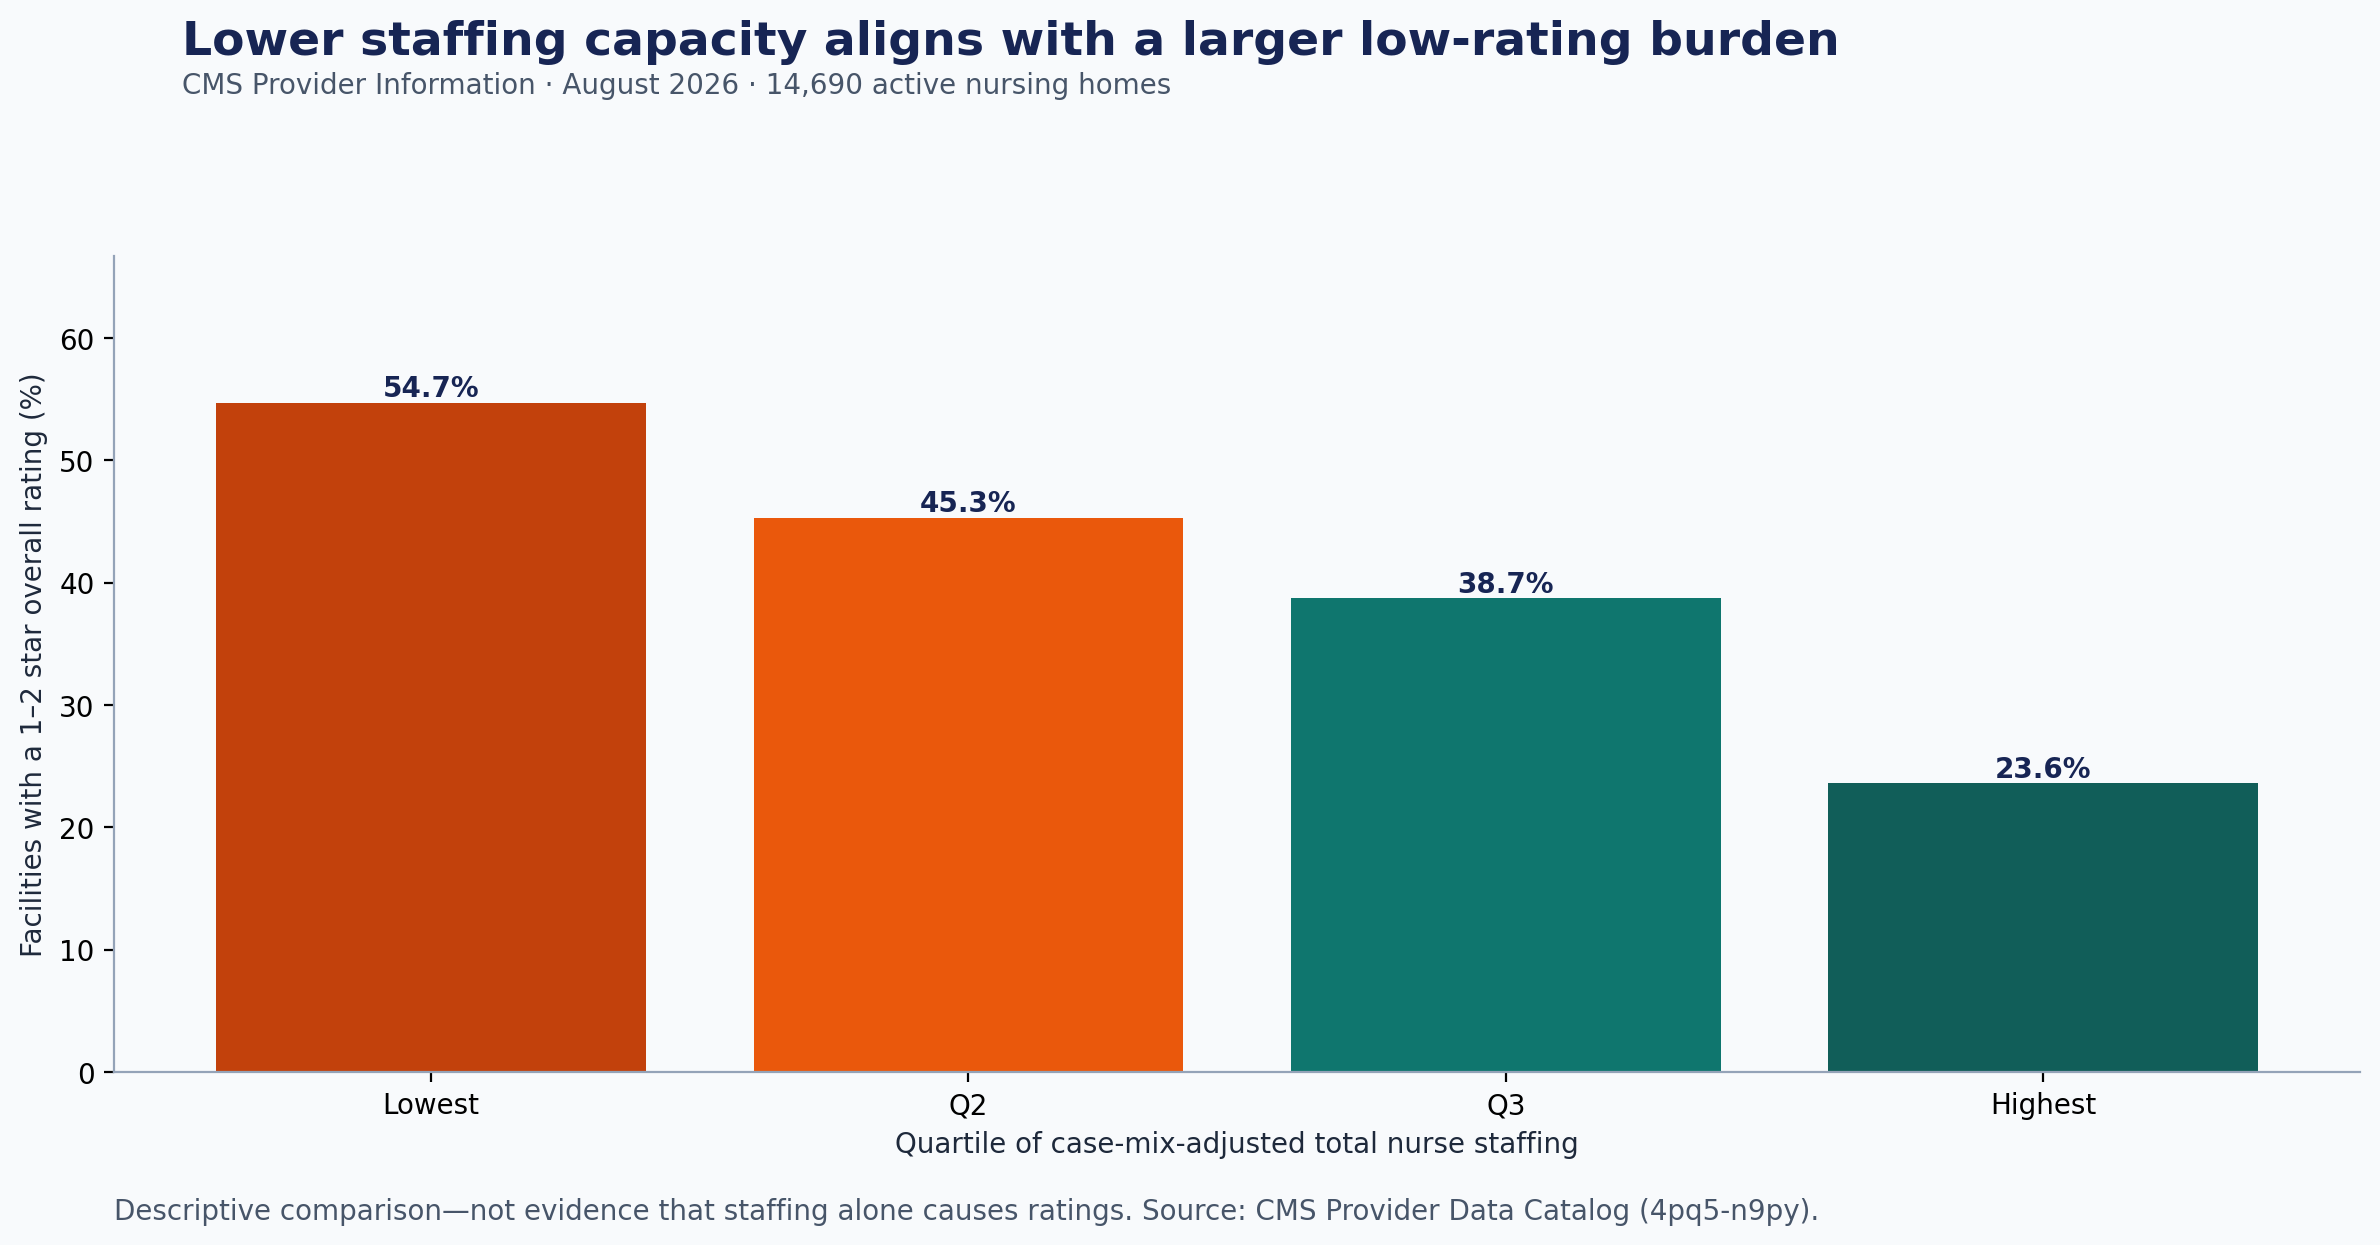
Key insight: 54.7% of facilities in the lowest adjusted-staffing quartile had 1–2 stars, compared with 23.6% in the highest. Staffing and turnover both remained associated with low ratings after adjustment.
Cross-sectional associations, not causal effects or facility rankings. The complete-case model included 13,317 of 14,690 facilities.
RDuckDB SQLPythonLogistic regression
Explore the repository
MORTALITY SURVEILLANCE × TREND ANALYSISCASE STUDY / 06
Provisional Drug-Involved Overdose Signals
A CDC/NCHS analysis separating broad national change from drug-specific and HHS-region exceptions.
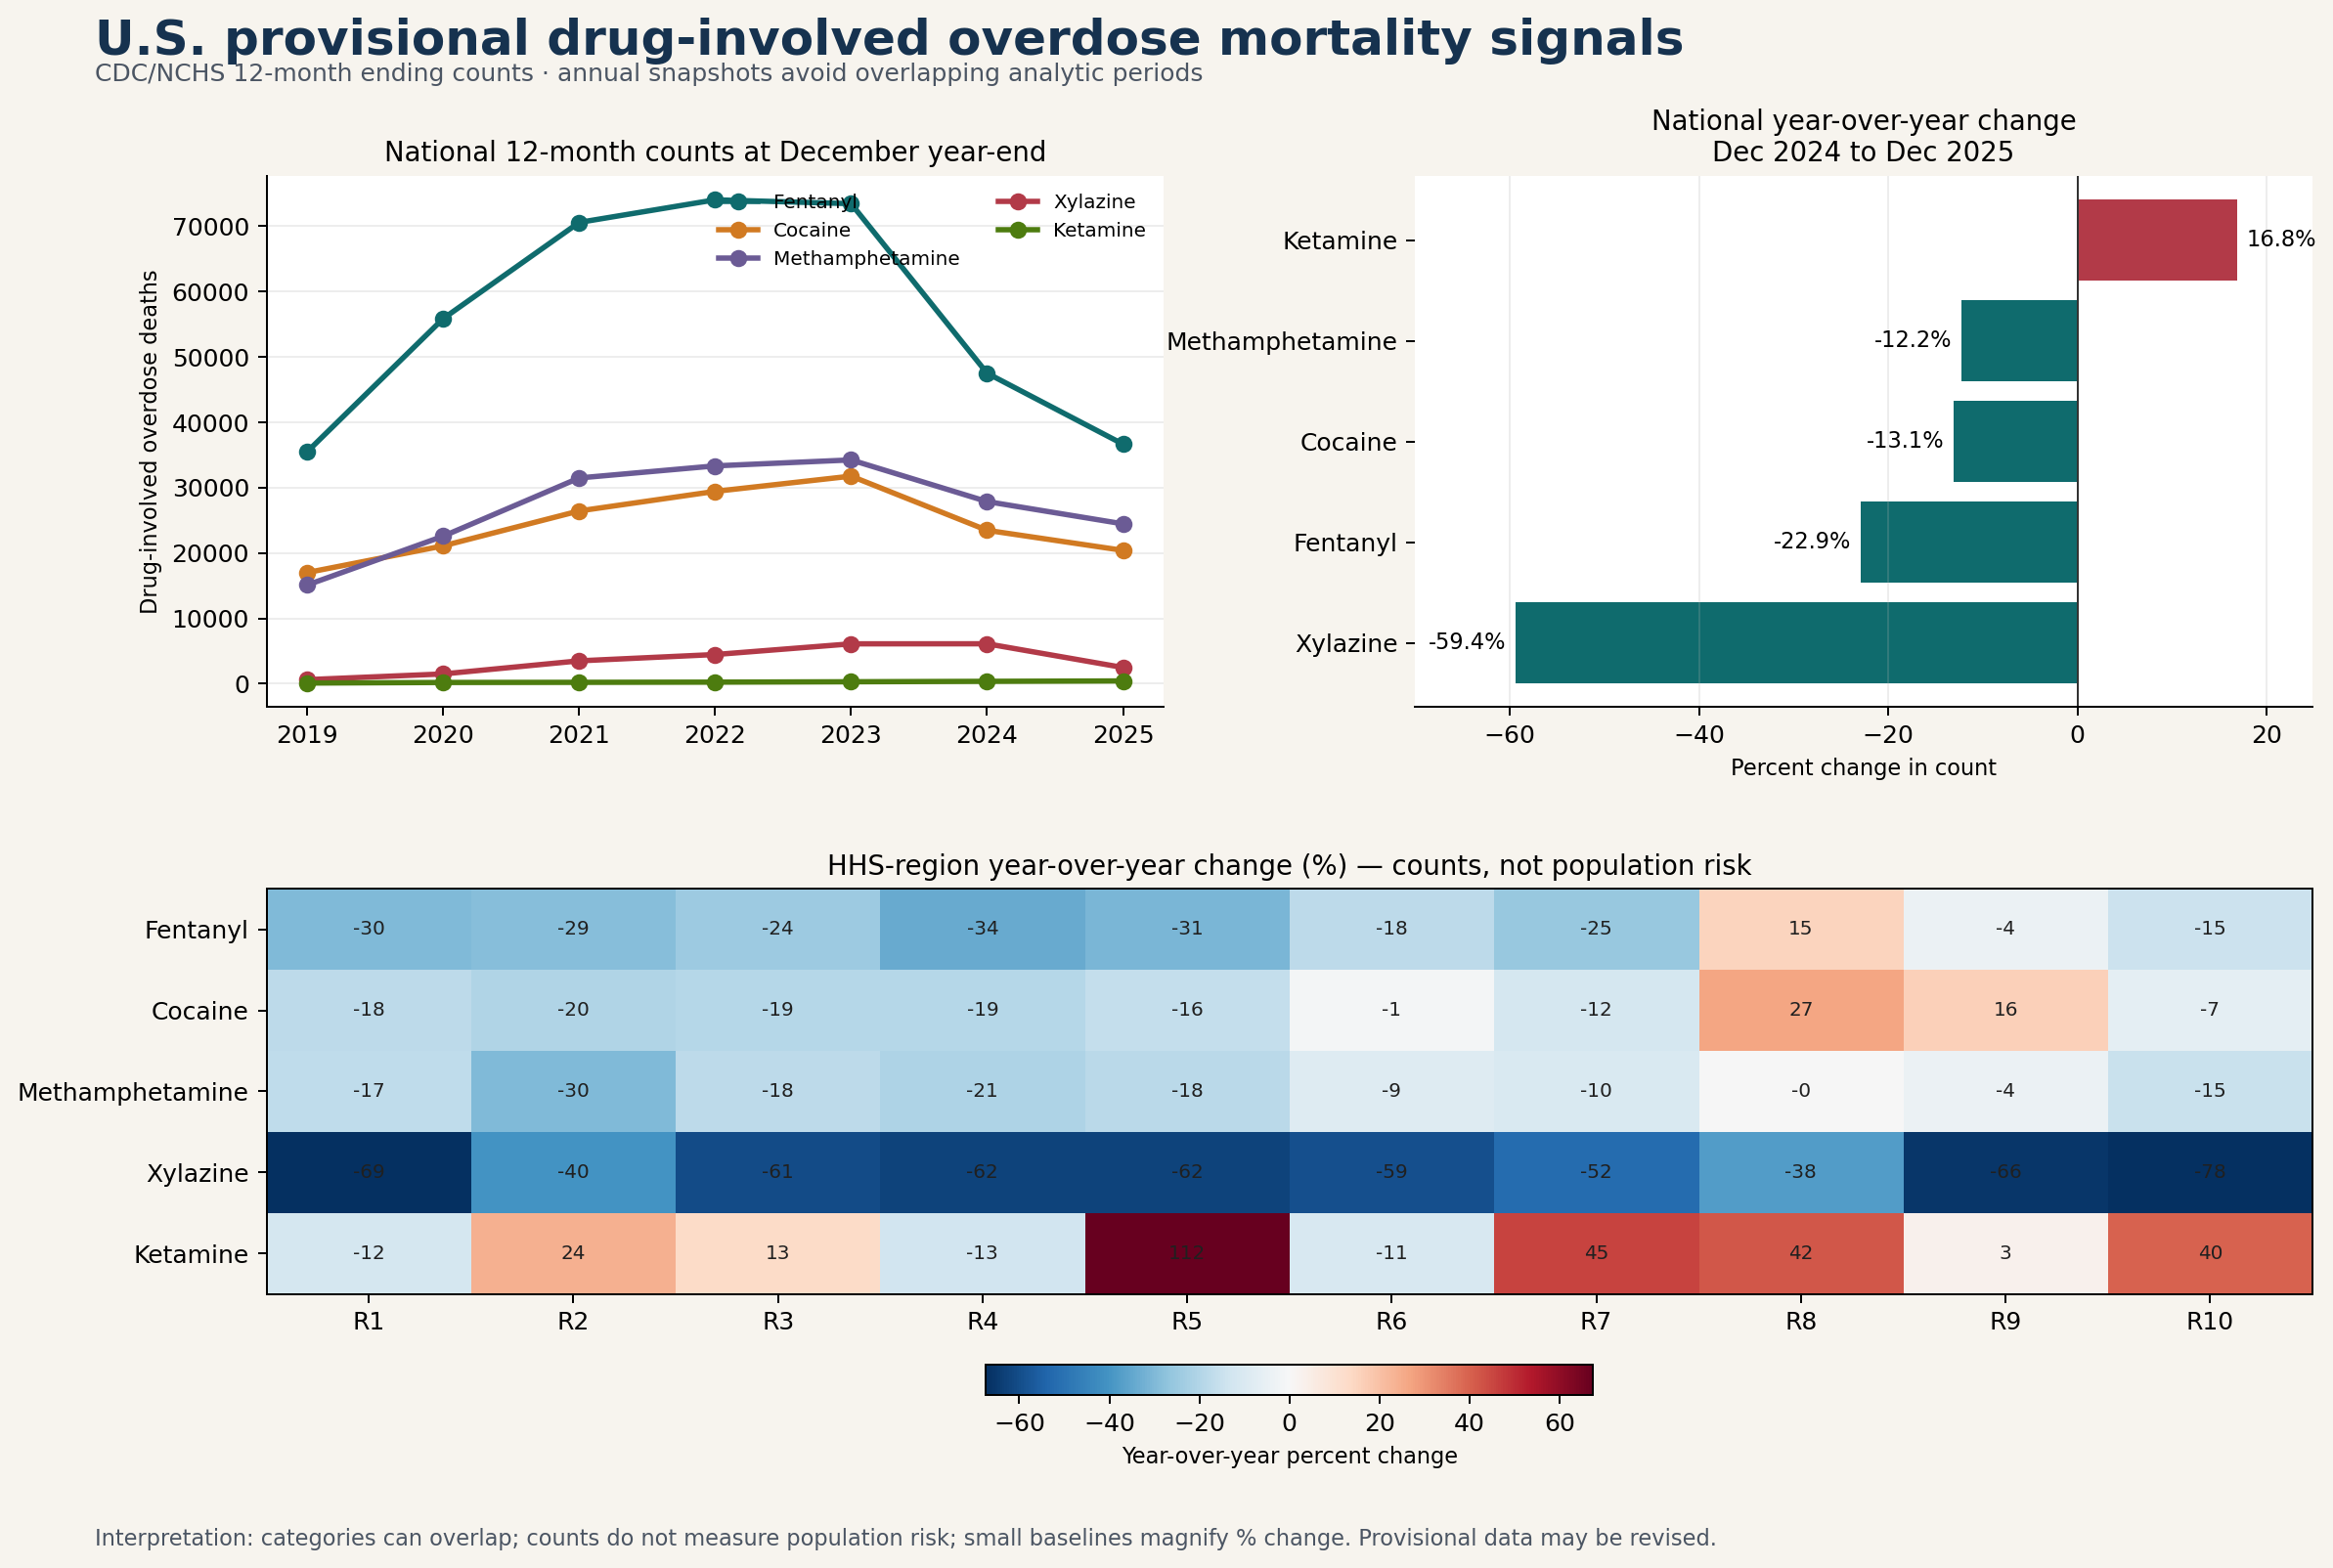
Key insight: Fentanyl remained the largest tracked category at 36,627 deaths but declined 22.9%; ketamine increased 16.8%, while cocaine rose in Regions 8 and 9 despite a national decline.
Provisional counts, not population-adjusted risk. Drug categories overlap, small baselines magnify percentage change, and results do not establish causation.
SASPythonCDC/NCHSQA/QC
Explore the repository
HEALTHCARE OPERATIONS × QUALITYCASE STUDY / 05
Emergency Department Throughput Benchmarking
A CMS Care Compare analysis of hospital-reported ED time, volume, state patterns, and public reporting completeness, with independent SAS validation.
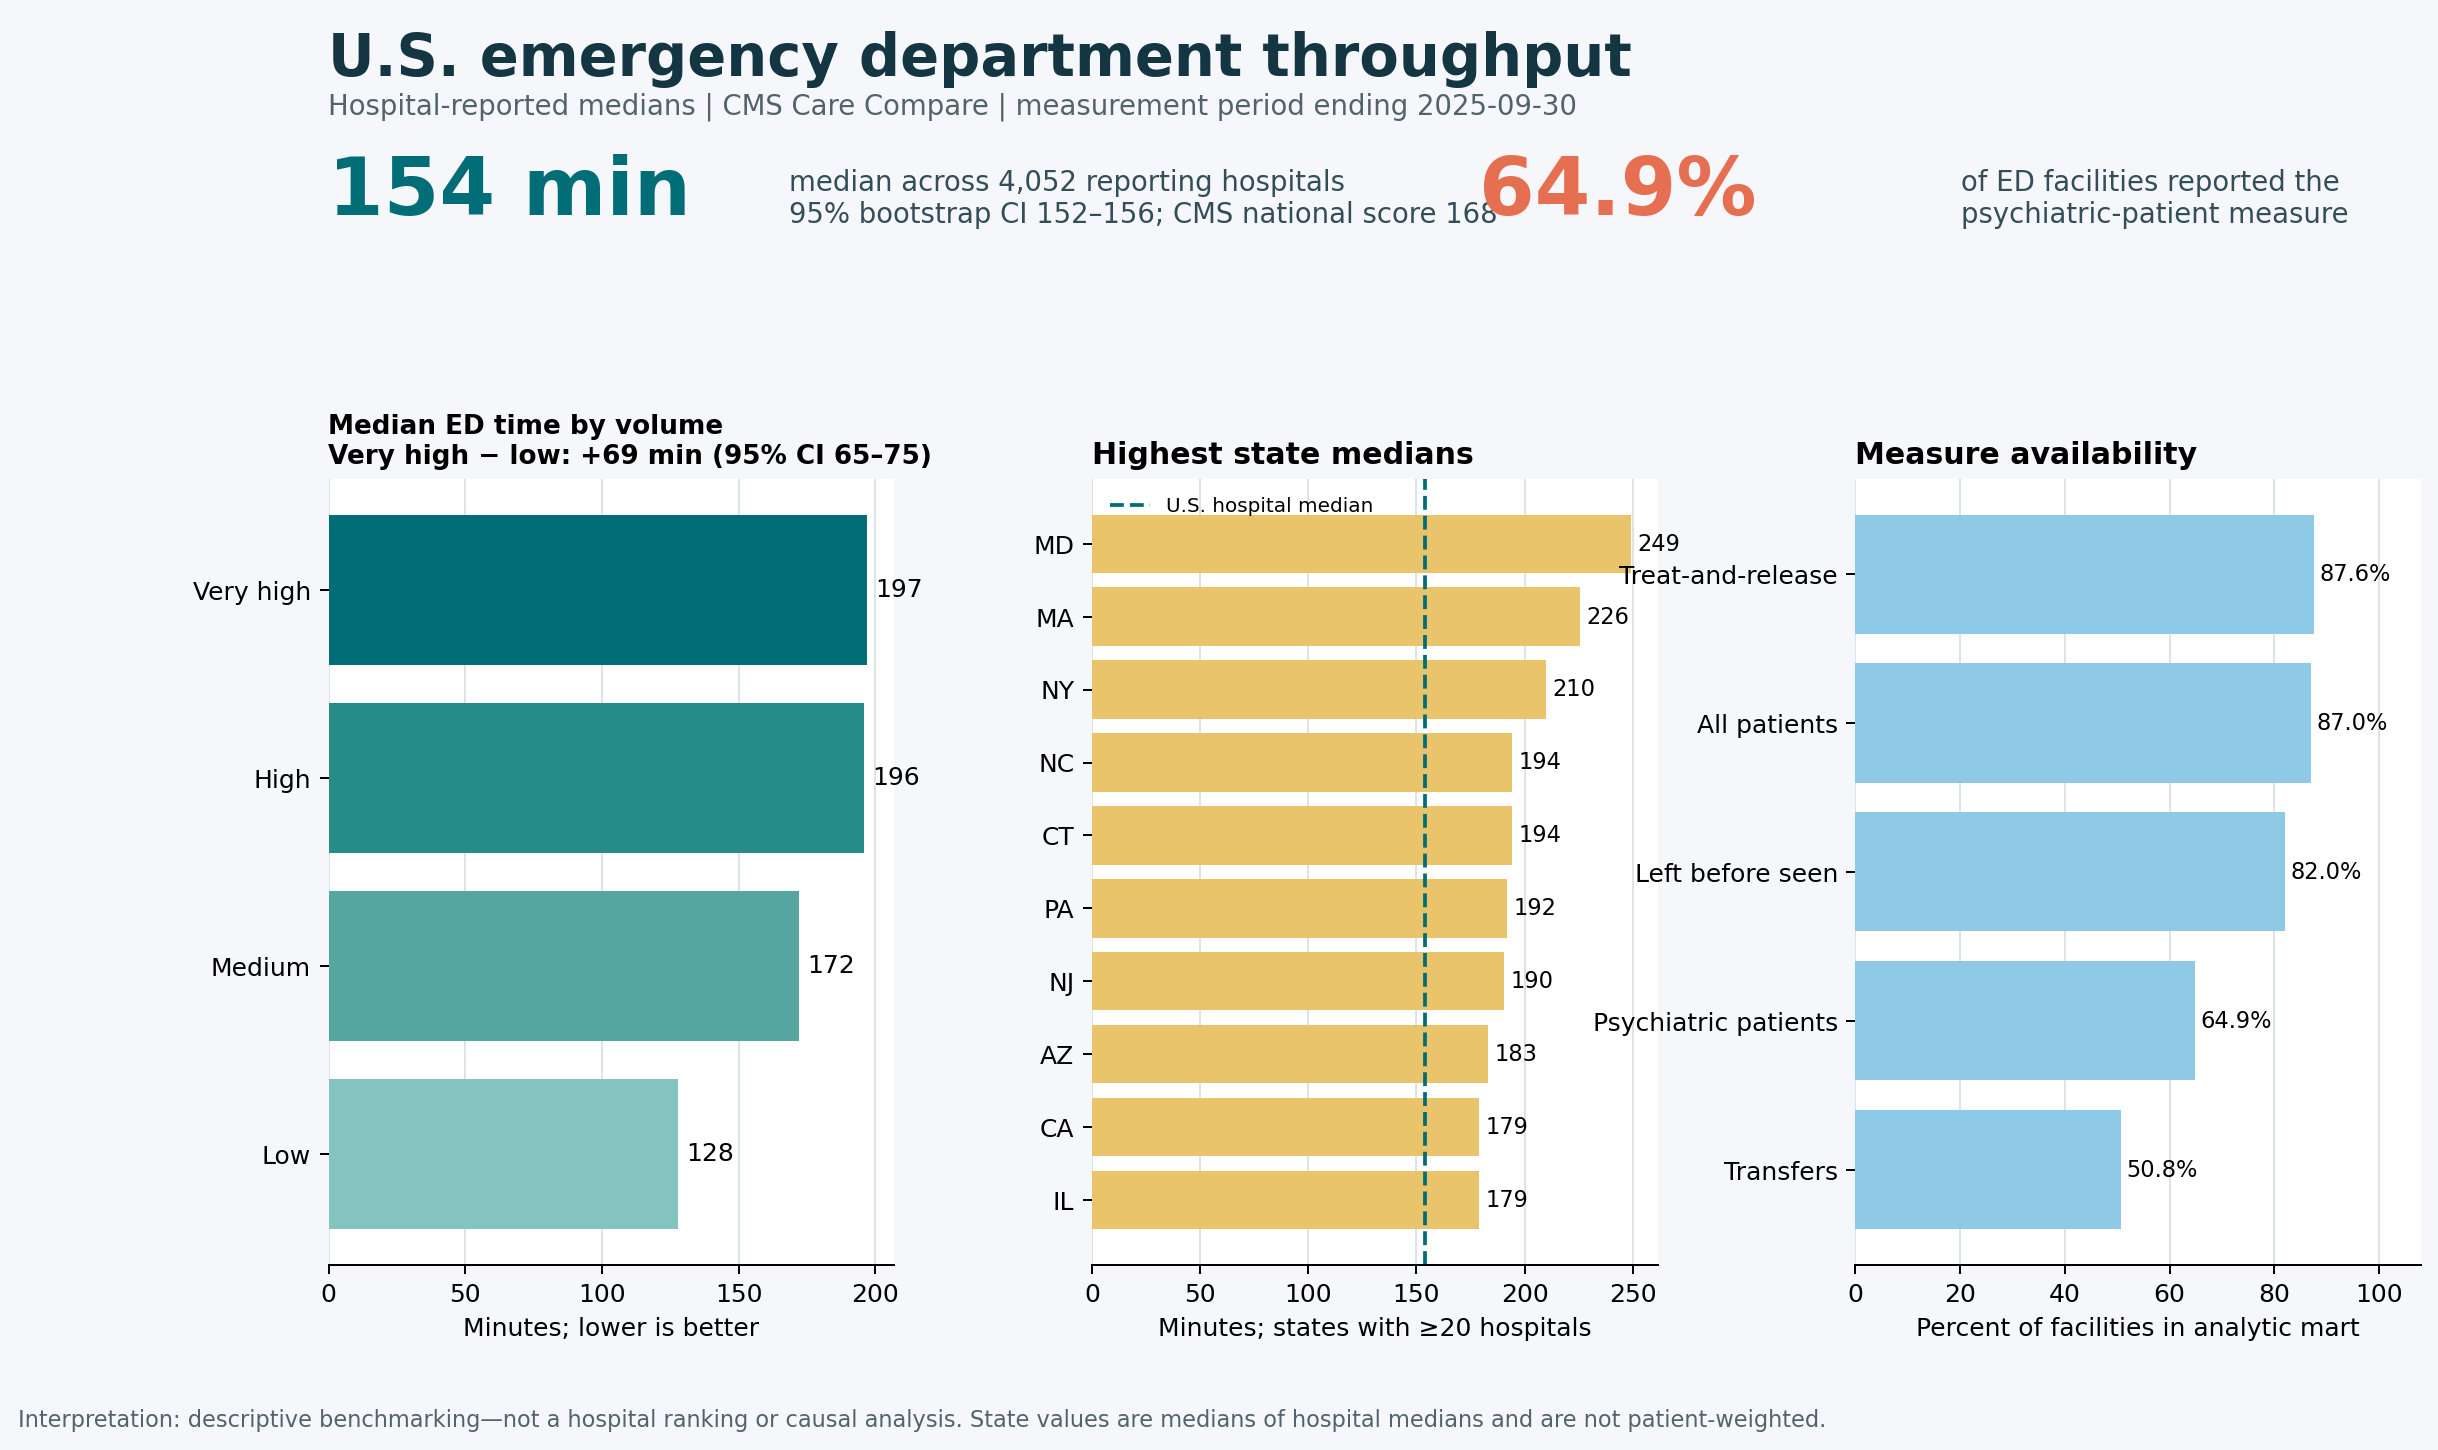
Key insight: Very-high-volume and low-volume ED groups differed by 69 median minutes (95% bootstrap CI: 65–75) across the updated reproducible analysis.
Descriptive benchmarking, not a hospital ranking or causal analysis. State values are medians of available hospital medians and are not patient-weighted.
SASPythonDuckDB SQLCMS
Explore the repository
CLINICAL TRIALS × TRANSPARENCYCASE STUDY / 04
Type 2 Diabetes Trial Results Transparency
A reproducible analysis of whether completed Phase 2–4 type 2 diabetes trials have summary results available on ClinicalTrials.gov.
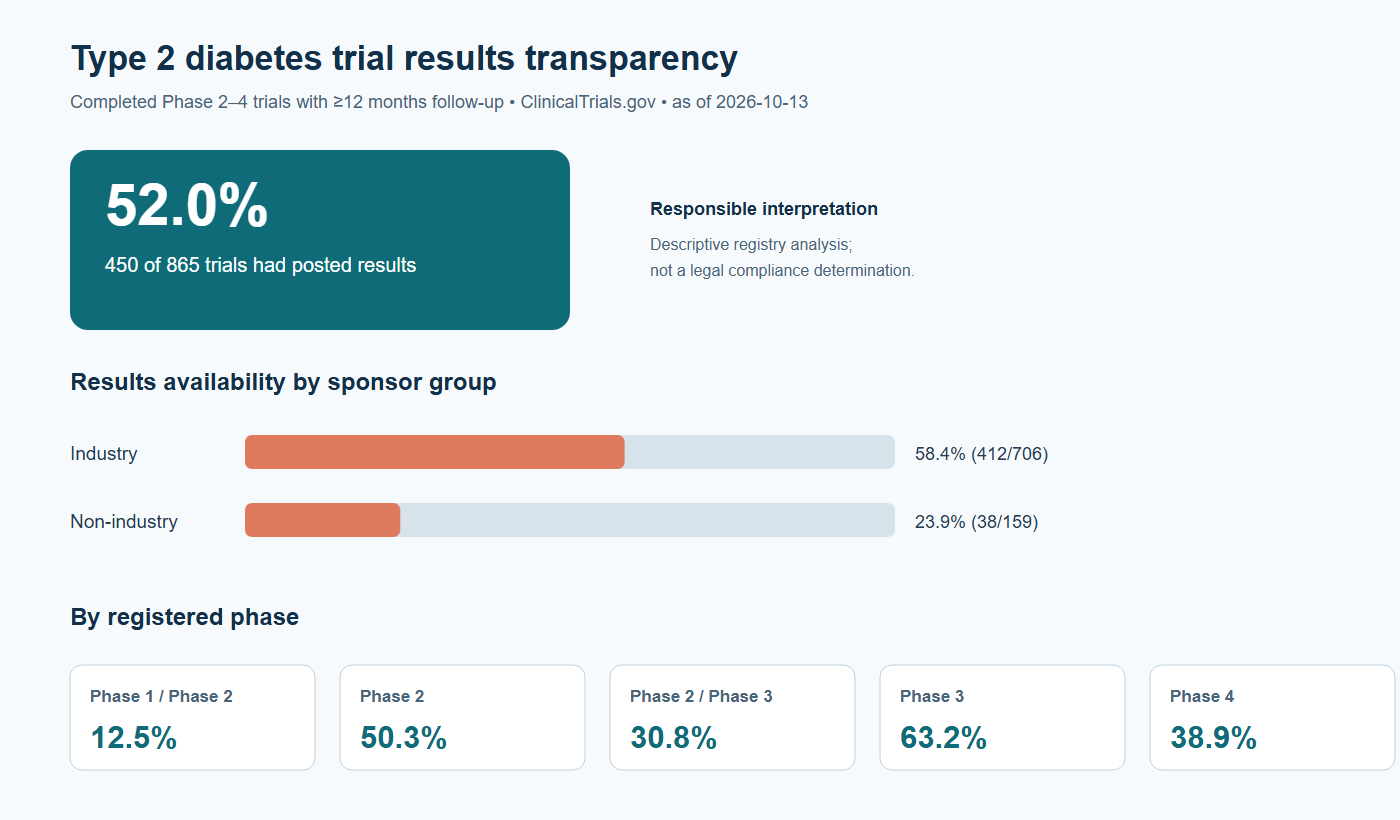
Key insight: 450 of 865 eligible trials (52.0%) had posted summary results. Availability was 58.4% for industry-led trials and 23.9% for non-industry-led trials.
Descriptive registry analysis, not a legal-compliance determination. The sponsor comparison is unadjusted and does not establish causation.
SASPythonClinicalTrials.govQA/QC
Explore the repository
INFECTIOUS DISEASE × SURVEILLANCECASE STUDY / 02
Pertussis Surveillance Priorities
A CDC surveillance analysis showing why population-adjusted incidence and absolute case burden lead to different operational priorities.
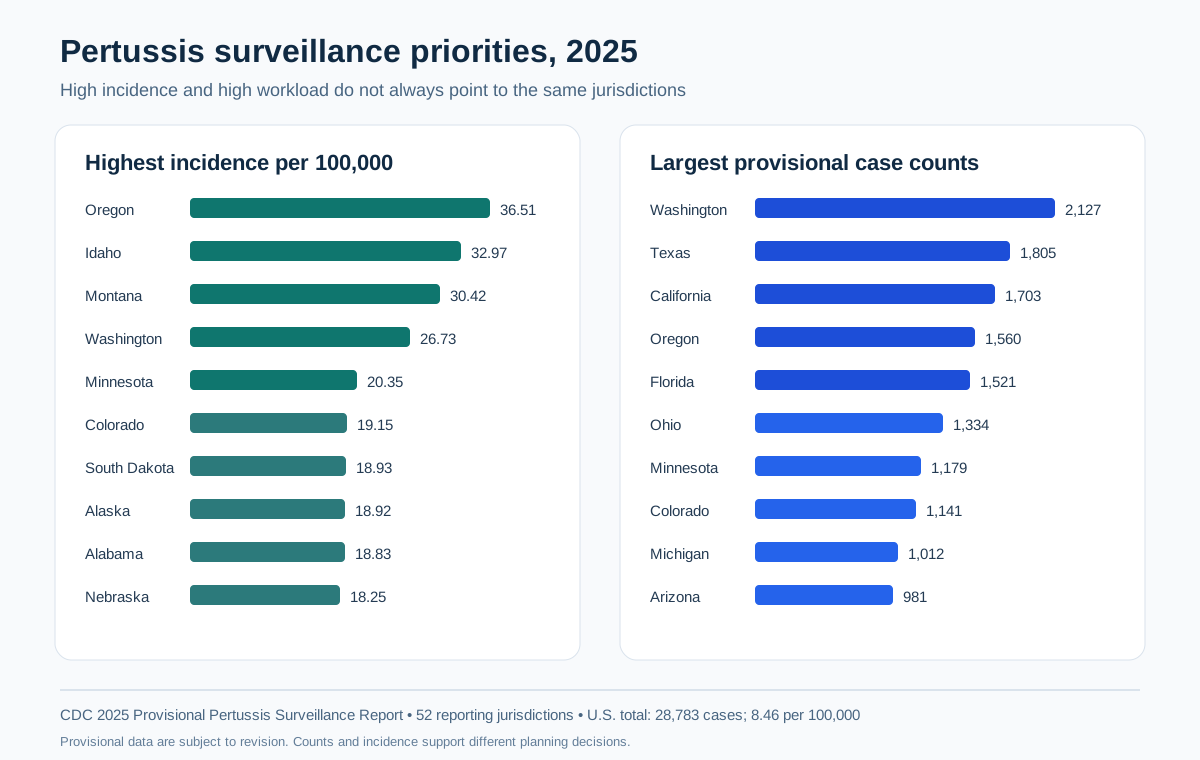
Key insight: Oregon had the highest reported incidence, while Washington had the largest case count. Texas ranked second by count but remained below the national incidence rate.
DuckDB SQLQGISSurveillanceQA/QC
Explore the repository
BIOSTATISTICS × POPULATION HEALTHCASE STUDY / 03
Hidden Hypertension
A complex-survey analysis of measured blood pressure, diagnosis awareness, medication use, and control among U.S. adults.
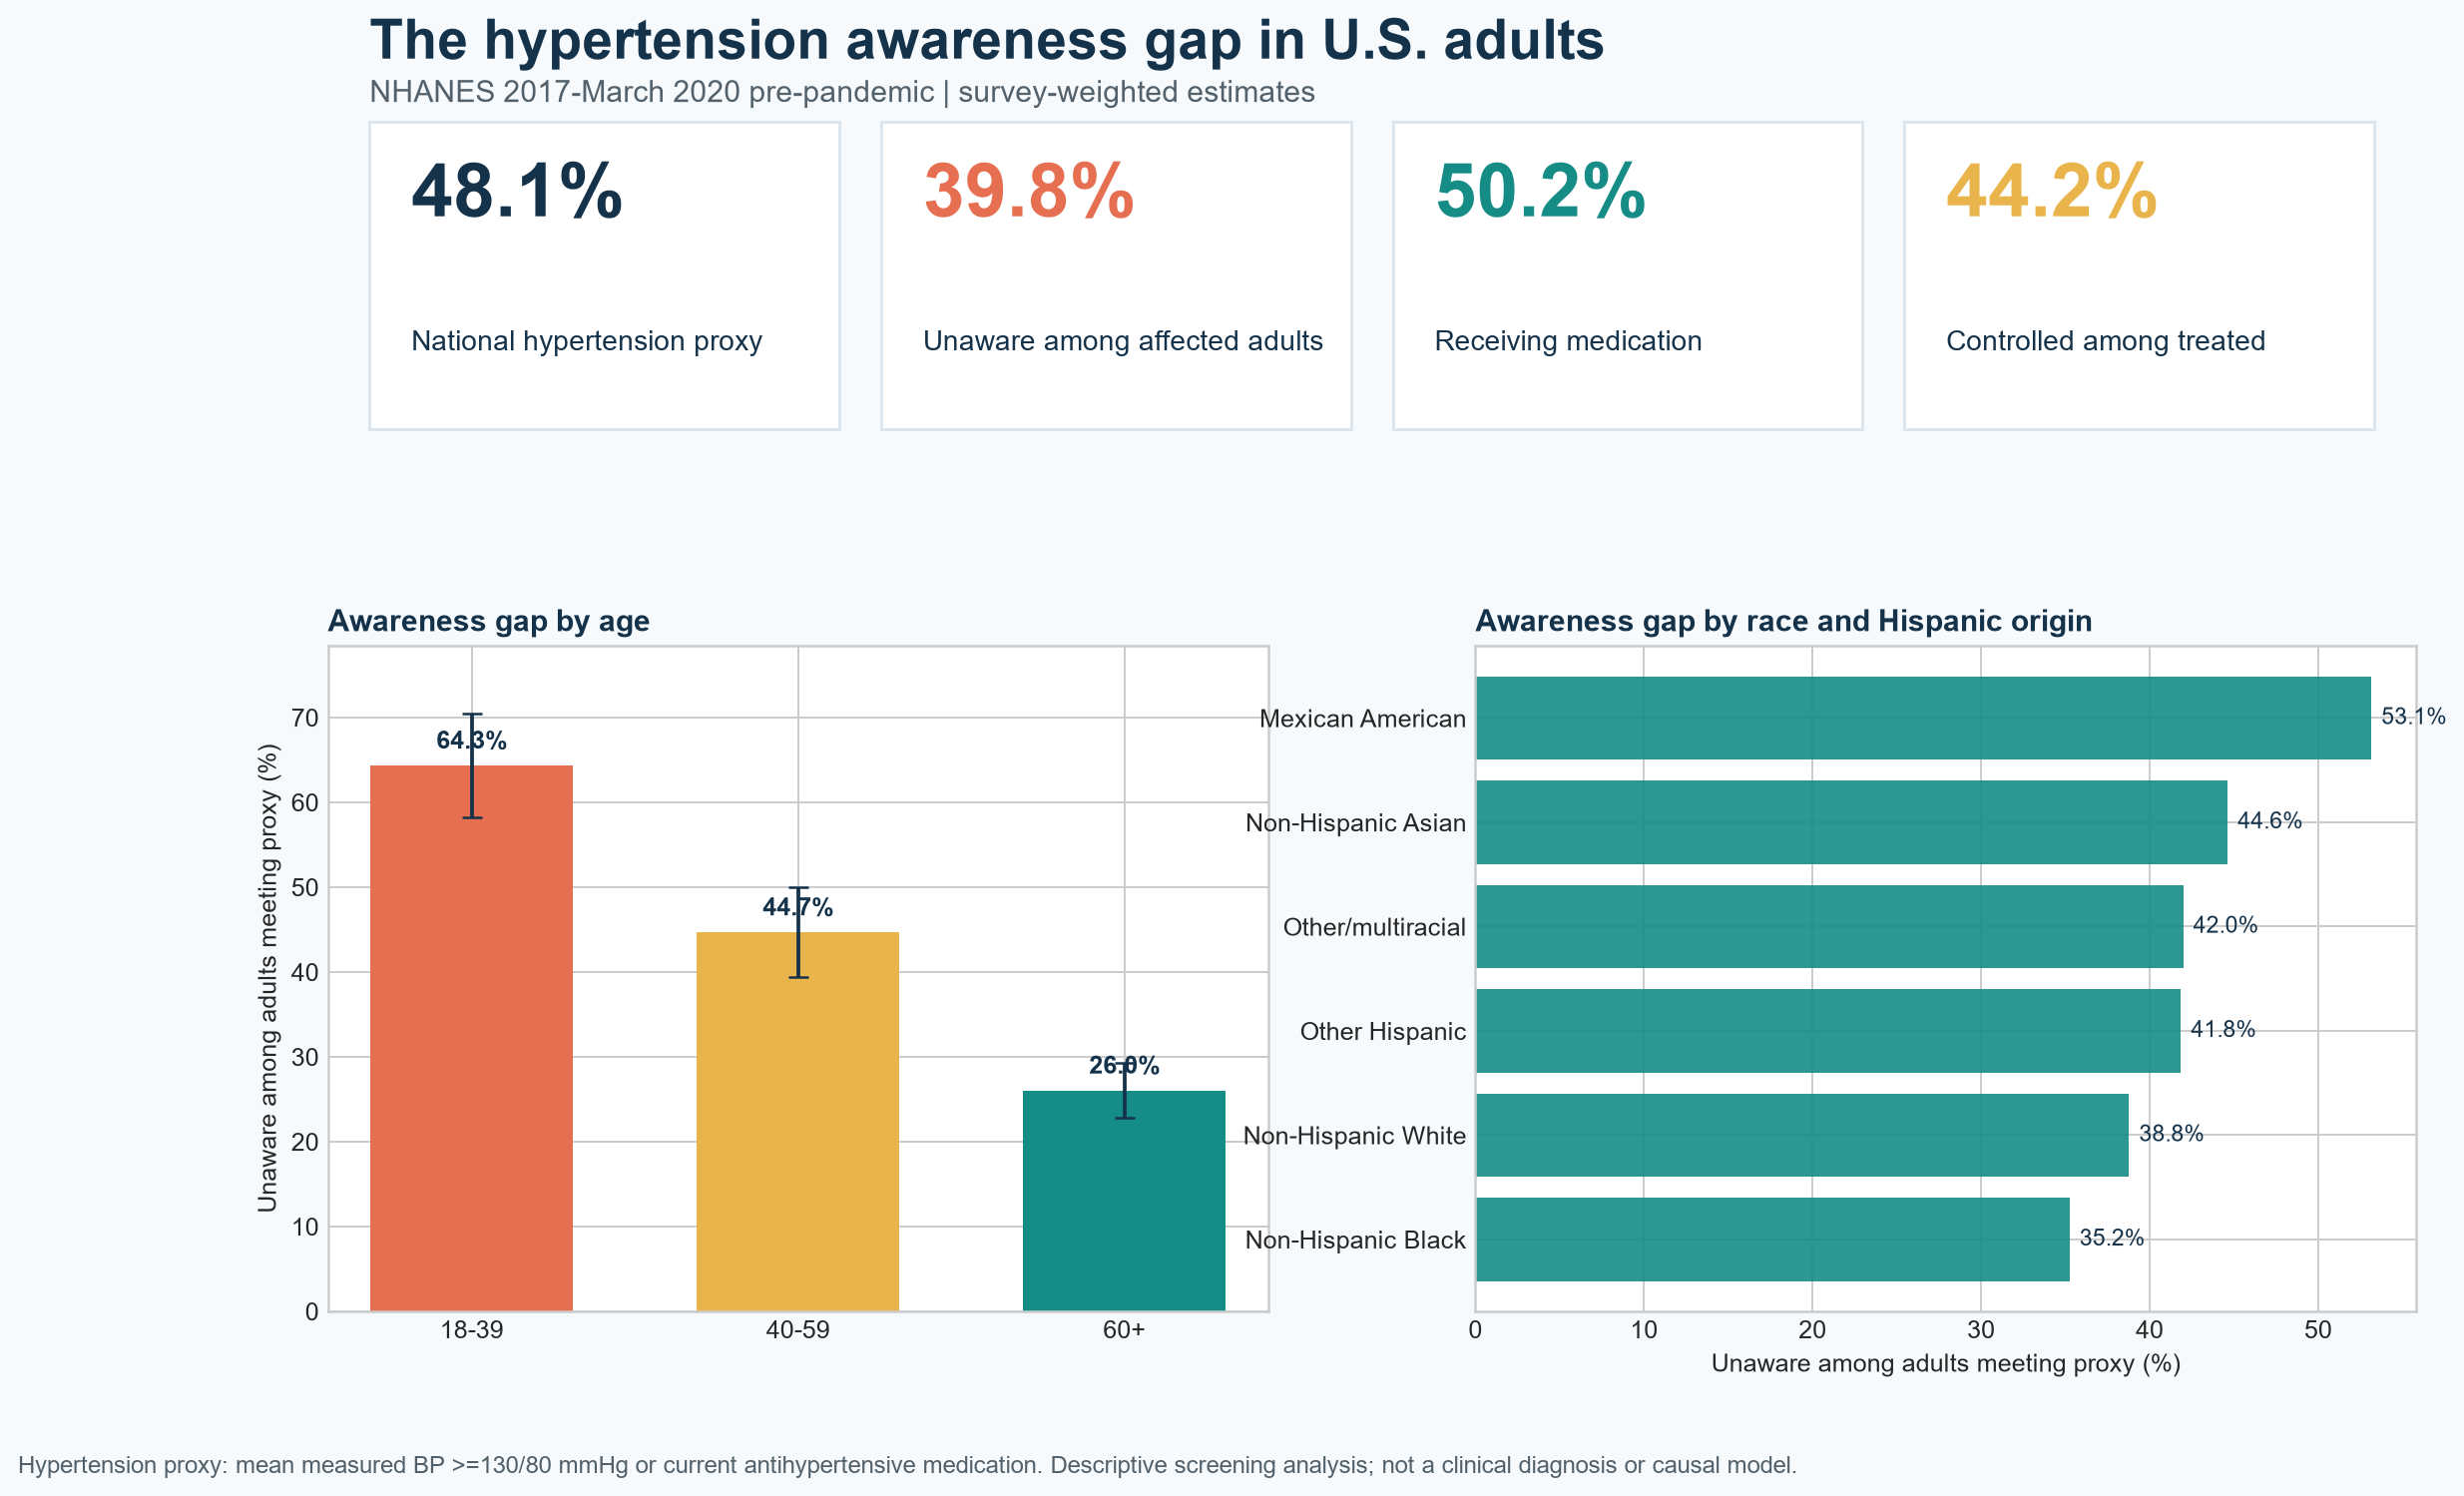
Key insight: 39.8% of adults meeting the primary hypertension proxy reported no prior diagnosis in the analyzed NHANES sample.
SASPythonNHANESSurvey methods
Explore the repository